


- Betsy Stefany
- Coordinator STEM Literacy Community of Practice
- STEM Literacy Community of Practice
- The SABENS Group
- Jeffrey Beaudry
- Professor
- STEM Literacy Community of Practice
- University of Southern Maine
- Tina Bishop
- Education Evaluation and Research Specialist
- STEM Literacy Community of Practice
- The SABENS Group
STEM Literacy Community of Practice
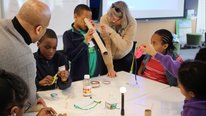
The video updates the progress of NH MSP, “STEM Literacy, Community of Practice”. The continued digital integration projects focusing on light and heat transfer and required innovative evaluation design. This video includes the evaluation team’s view and shares images of activities spanning from the classroom glare to measuring Albedo.
The progress of the MSP STEM project as a sustained Community of Practice relies on online access for teachers, recognizing the increasing expansion of sensors in industry and research. Their increasing availability expands individual action projects to community and comparison sites. STEM Literacy practice defines and unites diverse projects, requiring text, visual and data languages. enabling teachers to practice with emerging digital tools while increasing the relevancy of their projects.
Sharing similar sensors between contrasting locations increases interest in data output. These seasonal activities enter their third year. Diverse initial teacher classroom visualization tools engage classroom students, producing potential products that enable further collaboration between partners’ programs. Transforming the classroom as practice and model expands student interest to explore beyond the practice application. The goal is to apply their skills to observe phenomenon, involve digital resources and in the process, provide digital evidence in multiple measurable forms.
Their designs increasingly build on local data feedback. Individuals form cohorts, identify resources and practice ELA activities, discussing media purposefully selected to encourage interaction. Topics addressed in Teacher PD transfer, transmitted by classroom practice with digital tools, providing both student evidence and initial curiosity that continue beyond their grade, classroom or geographic limits.
STEM Literacy Community of Practice
The video updates the progress of NH MSP, “STEM Literacy, Community of Practice”. The continued digital integration projects focusing on light and heat transfer and required innovative evaluation design. This video includes the evaluation team’s view and shares images of activities spanning from the classroom glare to measuring Albedo.
The progress of the MSP STEM project as a sustained Community of Practice relies on online access for teachers, recognizing the increasing expansion of sensors in industry and research. Their increasing availability expands individual action projects to community and comparison sites. STEM Literacy practice defines and unites diverse projects, requiring text, visual and data languages. enabling teachers to practice with emerging digital tools while increasing the relevancy of their projects.
Sharing similar sensors between contrasting locations increases interest in data output. These seasonal activities enter their third year. Diverse initial teacher classroom visualization tools engage classroom students, producing potential products that enable further collaboration between partners’ programs. Transforming the classroom as practice and model expands student interest to explore beyond the practice application. The goal is to apply their skills to observe phenomenon, involve digital resources and in the process, provide digital evidence in multiple measurable forms.
Their designs increasingly build on local data feedback. Individuals form cohorts, identify resources and practice ELA activities, discussing media purposefully selected to encourage interaction. Topics addressed in Teacher PD transfer, transmitted by classroom practice with digital tools, providing both student evidence and initial curiosity that continue beyond their grade, classroom or geographic limits.
-
 YouthAstroNet: Exploring STEM Careers with Robot Telescopes
Mary Dussault
-
 PBS is Building the Next Generation of STEM Communicators
Leah Clapman
-
 Measuring New Indicators for K-12 STEM Education
Jessica Mislevy
-
 WGBH: Bringing the Universe to America's Classrooms
Rachel Connolly
-
 Computer Science, STEM Integration and Teacher Collaboration
Joyce Malyn-Smith
-
 Expanding Computing Education Pathways (ECEP) Alliance
Mark Guzdial
5550 Views
Continue the discussion of this presentation on the Multiplex. Go to Multiplex
5550 Views
presentation
has been viewed
Related videos you might be interested in...
-
YouthAstroNet: Exploring STEM Careers with Robot Telescopes
Mary Dussault
-
PBS is Building the Next Generation of STEM Communicators
Leah Clapman
-
Measuring New Indicators for K-12 STEM Education
Jessica Mislevy
-
WGBH: Bringing the Universe to America's Classrooms
Rachel Connolly
-
Computer Science, STEM Integration and Teacher Collaboration
Joyce Malyn-Smith
-
Expanding Computing Education Pathways (ECEP) Alliance
Mark Guzdial
Betsy Stefany
Coordinator STEM Literacy Community of Practice
The video, “Tracking Digital Integration” shares glimpses of projects advancing since the 2010-2014 NH DOE STEM Literacy Community of Practice. Initially the goal was to engage teachers with digital programs and introduce digital tools to advance interest in emerging STEM topics.
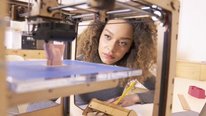
The diverse locations of teachers produced unique projects, enhanced by the innovation of encouraging them to develop individual interests to cohort teams. Impacts in communities expand from varied grade level to beyond the school and engaging local and online community. They range from Maker to outdoors classrooms and include ELA extensions. As we continue, students of these teachers are developing Extended Learning Opportunities (ELO’s) further advancing programs and projects.
We invite viewers to discuss the challenges and opportunities of evaluation and monitoring as change occurs from evaluation of teachers introducing digital systems to their students using them. Some projects like the Solar Car Sprint program have clear numerical expansion (from 8 teams to 27 this June) and products from their programs. Others that integrate digital tools to monitor form a broader community of shared reports and team efforts like integrating digital tools in existing programs challenge evaluation. We invite your questions and suggestions that help us expand our views from your perspectives.
Please go back here: http://stemforall2016.videohall.com/presentations/788
Tina Bishop
Education Evaluation and Research Specialist
Hello everyone,
I am the Academic Director of the College of Exploration in Virginia and have conducted educational research and program evaluation for over 20 years, primarily in the area of science.
I worked with Betsy on this NH STEM project as an evaluator and I look forward to hearing you perspectives about this project. I also hope to learn about similar projects that you may be doing and to hear innovative techniques for evaluation that you may have incorporated in your work.
Welcome to all!
Tina Bishop
Education Evaluation and Research Specialist
If you would like to learn more about the developmental evaluation method that was used for this NH DOE STEM project, here is a link to a video introduction to the topic.https://vimeo.com/217594587 Developmental Evaluation
Betsy Stefany
Coordinator STEM Literacy Community of Practice
Thank you, Tina for this video! The MSP was set up initially to be evaluated on line, video and teacher interviews however the constant quarterly monitoring between the College of Exploration and the project manage on the extensions of the teacher projects indicated that there might be an opportunity to interject new processes into the progress. The MSP goas were to involve 50 teachers however it was to the advantage of the rural application to invite in more district representatives and, in the end over 100 participated.
The still pictures with the dates in the video are part of the visual "capture" to enable more sharing of key elements. I am curious as to how other projects are dealing with the steady spread of STEM into new applications and projects.
Jennie Lyons
Computer Science Specialist
There seem to be a number of projects that the teachers are implementing in the video. Are teachers all involved in the same digital projects or are the projects unique to teachers?
Jeffrey Beaudry
Professor
The projects are unique to each teacher for now. That is the intent, to have teachers find new applications. I have a project called Picture Post, and this added a dimension of enhanced data to the project.
See http://picturepost.unh.edu
Betsy Stefany
Coordinator STEM Literacy Community of Practice
Jennie,
Thanks for asking this question. The teachers all had the same program as professional development from our partner, JASON Learning (jason.org) and also access to USGreen Building Council’s online Green Educator course. From that exposure teachers developed projects to explore digital tools that varied from data loggers to IPads and developing full programs as a district! Creating cohorts to teach others on their experiences at state level conferences built further teacher engagement with the digital tools and also a great segway to the new NH concept of Extended Learning Opportunities, (ELO’s) where students develop projects.
Ben Sayler
Professor, Physical Science and Mathematics
Could you say more about the professional development that teachers experience? How many hours of professional development are involved? Face-to-face? Online? What types of activities do teachers engage in and what supports are in place to help teachers transfer what they're learning into their classrooms? Thanks!
Betsy Stefany
Coordinator STEM Literacy Community of Practice
Ben, Good to continue to probe this area. The professional development design is a question that all of us should be thinking more about when it comes to digital tools. There's a difference between learning how the product is designed and how it integrates into use.
The project began with an award from an online program for face-to-face PD for their materials and specific trainers that integrated the online and hands on materials into the classroom at the lead location. While this interaction taught the materials, the hard work begins with integration and adding further digital tools. The best innovation was the further developed design, sharing between teachers beyond how tools work to how they engage their students to perform beyond their current practices. This conversation evolved from a summer,
“tool event” that focused on specific questions of integration and called upon CTE, private boarding school teachers and also individuals that could practice with the tools and debug or at least identify challenging areas. We created short case studies of challenges within the project, then modeled the situation. Lastly we added that new tools were tested internally by one individual who would shake out the quirks to save the teachers time.
Betsy Stefany
Coordinator STEM Literacy Community of Practice
The span of time for this project was one of continual summer "blasts" of new technology and systems in NH. In the first year, the IPad initiative arrived and by 2012 the Google wave entered. Both brought individual district advances that enriched the project.
Ben Sayler
Professor, Physical Science and Mathematics
I'm curious what kinds of data have been collected and what findings have emerged.
Jeffrey Beaudry
Professor
In my project we have been collecting digital images as part of our Citizen Science website called Picture Post. It is open source, and the purpose is to collect repeated images from a fixed point. The analysis of the data is left to the users. There are numerous ways to apply data analysis tools that come with the Picture Post website.
See http://picturepost.unh.edu
Betsy Stefany
Coordinator STEM Literacy Community of Practice
Ben,
The data types differ vastly.
Very great that you are following the image thread in the video....and thinking about the multiple types of data that string along with this project! I realized from your request that I’d not referred to last year’s video.
Please go back here: http://stemforall2016.videohall.com/presentations/788
Last year summarizes the end of the project, however the formal summary was more innovative. In the last two years we have continued to expand from the teacher data to student evidence and also digital collections. I’ll be glad to explain those levels here or you can email me at bastefany@gmail.com if this conference ends before you have time to think of the teacher to student to project and all with digital tools in place implications!
Ben Sayler
Betsy Stefany
Coordinator STEM Literacy Community of Practice
Reading comments from other projects, I notice that data capture/use and evaluation is one continual question. Since our project goal was to incorporate digital technology the question continually turned to how to also apply digital tools into a system of ongoing formative evaluation. Attendance at professional development sessions was only one aspect as the expense and timing were challenges that digitization was intended in part to relieve.
The data from the data loggers shown in this visual are being used in multiple applications and the teachers have tailored them to the grade level over time. Their engagement with these particular items were not their choice. The loggers collect info on light and temperature and produce a dual data graph and were selected from the initial results of the MOSART tests required by the NH MSP in 2010. The tests indicated that teachers need practice with understanding light, heat transfer applications and dual variable graphing.
With the varied tools involved we challenged the teachers to demonstrate student evidence of their PD and developed a rubric that enabled them to move through the three years ratcheting up expectations.
As teachers scaled up their projects for classroom applications they met district needs to adjust to new standards. A demonstration of that positive teacher engagement is The Solar Sprint event which has from 8 teams to 27, each with at least 3-4 students per team. Teachers presented to their board ensuring that the event and class time continues. Another is the summer program and still another is a rebuilt outdoor learning boardwalk.
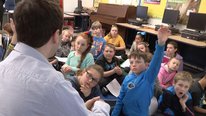
The ELA element shown has both a science entry with a signout and group (physical discussion) and an ELA educator in another district using online systems. These varied examples are captured as "student evidence" of educator's PD. Teachers proudly invites the project manager to their classes when the digital tools are in use or after materials were produced by the tools which is why the video has still pictures with date and time stamps.
What we find from these multiple forms of digital data types is that form builds the potential of sustainability both in program and in interest development. Teachers develop the digital skills to record what they see as positive results and actions. These positive images become valued communication elements for the community and also the student. Programs like Donors Choose and crowd sourcing depend more on the visual data than the statistical and for rural locations the stats often fail to show the full value of digital tool integration and change.
Kip Glazer
Dean of Students
I find your project's reach incredible, especially the inclusion of the ELA professionals as I feel strongly that literacy skills are foundational to STEM. I am just curious as to how you address the challenges that may arise from having such a broad and varied approach with allowing teachers to work on unique projects. You talked about cohort teams. Are there elements of competition?
Jeffrey Beaudry
Professor
Hello Kip, I contend that visual literacy is a major underplayed component of ELA and Common Core. The digital images we collect could indeed by put into a gaming environment, we have imagined many such scenarios. The challenge is to attract students and interested users to try this out. Jeff
Betsy Stefany
Coordinator STEM Literacy Community of Practice
The ELA 6th grade teacher and science teachers' reading shelf used their reading in further extended visual form. The science teacher had teams working with ICreate cams to develop visuals from group storyboards to explain complex terms like erosion. Once students see the challenge of creating the films the access the science shelf, sign out books and search for terms on their own.
The ELA reading/writing built a full year through various genre, mystery, poetry etc beginning with situating the students birth site. This process built a sense of identity with family and place. see Hollins Univ-Childrens Lit Director Setting contrasts through specific novels aligned with STEM topics were discussed through JASON Learning by students during the MSP. We anticipate developing further safe sessions to continue this cross regional engagement.
Betsy Stefany
Coordinator STEM Literacy Community of Practice
Kip,
Thank you for noticing that we ventured to be broad to enable projects that would extend from the initial support to anticipate STEM future directions back to the basics of ELA and further to where STEM would lead teaching with NGSS as a structure of support.
The challenge that you describe of being broad IS met by extending the geographic focus by loaning the data logger out to contrasting sites. By continually building new applications with the digital tools that were NOT requested by the participants but are ones in areas where they need support moves the content forward in science and industrial applications where STEM is designed to lead. knowledge of light applications is a topic that has slid by education but not industry. By moving into the concept of Community of Practice as a solution to what you notice as further challenges from the broad and varied approach we ease into the area of need.
At this point referring to the term Community of Practice seems to visually ease administrators from the concerns in the past of asking for a MOU from them or expecting them to require teachers in need to join the project. Also relaxes the teachers to move into student evidence from their interests in what they teach.
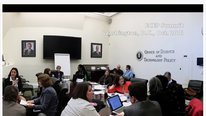
The question of cohort development is somewhat the area where competition MAY have crept in had it not been the timing of the era where digital integration, the use of the term Community of Practice and STEM pressures..without definition hit with the most impact...yet the least direction. Claiming STEM Literacy from what I knew was approaching teachers through following national policy AND the wonderful advantage of membership in the Council of State Science Supervisors during this time gave the MSP design an advantage.
Setting up the parameters and extending the timing to the change between NCLB where the past MSP's were developed and ESSA where they will need to work with ELA and beyond science and math again aids the concept of Community of Practice to ease the teacher to teacher stress.
I'd be eager to hear from other projects that have considered the concept of Communities of Practice to explain and/or design their scale up directions.
Kip Glazer
Dean of Students
As a former ELA teacher, I am thrilled to see the scientists appreciate and leverage the power of narrative and literacy. I also think that your use of the concept of Community of Practice is spot on as it allows the project to flex its strengths. I think that your assessment data has to be solid to validate the impact. Thank you for sharing your amazing project!
Betsy Stefany
Coordinator STEM Literacy Community of Practice
Kim,
Thank you for your kind probes to advance thinking on the where the project has ventured and where it can strengthen as we further develop as a CoP. Another advantage of a CoP is the reduction of timing pressures. I changed my role from “project manager” to “coordinator”, continuing to act as the communications hub while enabling watching for opportunities to collaborate with other projects that would fit the data concept of a CoP.
Your point that assessment data has to solidify and validate impact is well taken. This step required merging the formative assessment is in the classroom by the teachers using digital tools into a broader system with digital systems/platforms driving that evaluation. The impact would be that the system continually delivered assessment instead of as only in a final outcome from a grade level. This era of transition to ESSA offers that type of opportunity with careful stages. We can see a neat example here in the Showcase design, but we also know that one week is not a full system and that all of us have had to juggle with the “real world” to try this out fully!
The project focused introducing the text, visual and data as languages that lean on each other in STEM Literacy with “relevancy” as a key objective to advance into providing student evidence. This is sort of like a three legged stool under the exciting seat of a relevant topic. Each “leg” needs attention, however we tend to place our weight on the one that we feel most comfortable. Data analysis and applications beyond classrooms applications is the most difficult to balance, however working now with that aspect now as is hinted at with the film of the NASA AeroKat and the current work with the PicturePost project and Advancing Science program. Thank you for your supportive addition to our thinking and project’s future!
Jeffrey Beaudry
Professor
Betsy has taken the visual data and added some important additional elements, light intensity and temperature. Given that we can track these variables over time, we have a set of ever more objective methods to analyze digital imagery. We can balance the aesthetic and scientific in a more well-rounded learning experience.
Betsy Stefany
Coordinator STEM Literacy Community of Practice
Hi, Jeff,
The visual element has been the core connection in our project as it situates the site and enables a starting point where a younger age can find their way into a personal project. The Picture Post project assists the process of exploring with digital tools by anchoring the data logging practice beyond the classroom in sites with ownership and that have a visual process connected to online sharing.
Over the last year Jeff's site has explored adding the data loggers both literally into the post in an anchored position and also worked with extending the data contrasts between varied land cover near the specific post and with extended areas beyond the post location in NH, OR,SC, PA, VA, MA, and FL besides the Maine location. The resulting data was in preparation to fly the data loggers with the NASA AeroKat in the same alignment. The varied patterns on the ground have contributed to understanding the data patterns. Finding "Phenomenon" to study becomes easier once contrasting patterns are established.
Light and temperature are measurements that kids know and on which their day revolves. In our last slides we point out the work of our youngest and most distant site's research team in Oregon building a project. See the story board of their start...here TMStoryboard, Oregon Our goal is to engage others in following and recording their ventures with tools that follow them into the waters, fields, woods and atmosphere...in safe and sustainable projects.
We are off this summer to record the Eclipse, adding a recording site in Tennessee.
Thanks for visiting our site and look forward to hearing from our colleagues from the conference on their futures.
Jeffrey Beaudry
Professor
Betsy has taken the visual data and added some important additional elements, light intensity and temperature. Given that we can track these variables over time, we have a set of ever more objective methods to analyze digital imagery. We can balance the aesthetic and scientific in a more well-rounded learning experience.
Jeffrey Beaudry
Professor
Betsy has taken the visual data and added some important additional elements, light intensity and temperature. Given that we can track these variables over time, we have a set of ever more objective methods to analyze digital imagery. We can balance the aesthetic and scientific in a more well-rounded learning experience
Betsy Stefany
Coordinator STEM Literacy Community of Practice
Thanks to all who visited and also who answered questions on their comment system. The experience will help us extend the STEM Literacy Community of Practice and also build collaborations to improve STEM integration.
Further posting is closed as the showcase has ended.